In Depth and Interactive API Analytics available to all ServiceStack Apps


The big ticket feature of ServiceStack v8.7 is the comprehensive API Analytics available to all ServiceStack Apps configured with SQLite Request Logging.
Benefits of API Analytics
They provide deep and invaluable insight into your System API Usage, device distribution, its Users, API Keys and the IPs where most traffic generates:
- Visibility: Provides a clear, visual summary of complex log data, making it easier to understand API usage and performance at a glance.
- Performance Monitoring: Helps track key metrics like request volume and response times to ensure APIs are meeting performance expectations.
- User Understanding: Offers insights into how users (and bots) are interacting with the APIs (devices, browsers).
- Troubleshooting: Aids in quickly identifying trends, anomalies, or specific endpoints related to issues.
- Resource Planning: Understanding usage patterns helps in scaling infrastructure appropriately.
- Security Insight: Identifying bot traffic and unusual request patterns can be an early indicator of security concerns.
Interactive Analytics
Analytics are also interactive where you're able to drill down to monitor the activity of individual APIs, Users, API Keys and IPs which have further links back to the request logs which the summary analytics are derived from.
As they offer significant and valuable insights they're now built into all ASP.NET Core IdentityAuth templates, existing .NET 8 IdentityAuth templates can enable it with:
x mix sqlitelogs
.NET 8 Templates that are not configured to use Endpoint Routing
and ASP.NET Core IOC will need to explicitly register SqliteRequestLogger
as a singleton dependency in addition to configuring it on the RequestLogsFeature plugin:
public class ConfigureRequestLogs : IHostingStartup
{
    public void Configure(IWebHostBuilder builder) => builder
        .ConfigureServices((context, services) =>
        {
            var logger = new SqliteRequestLogger();
            services.AddSingleton<IRequestLogger>(logger);

            services.AddPlugin(new RequestLogsFeature {
                RequestLogger = logger,
                EnableRequestBodyTracking = true,
                EnableErrorTracking = true
            });
            services.AddHostedService<RequestLogsHostedService>();

            if (context.HostingEnvironment.IsDevelopment())
            {
                services.AddPlugin(new ProfilingFeature());
            }
        });
}
This will enable a more feature rich Request Logging Admin UI which utilizes the full queryability of an AutoQueryGrid to filter, sort and export Request Logs.

Analytics Overview
Utilizing an SqliteRequestLogger will also enable the new Analytics Admin UI in the sidebar which initially
displays the API Analytics Dashboard:
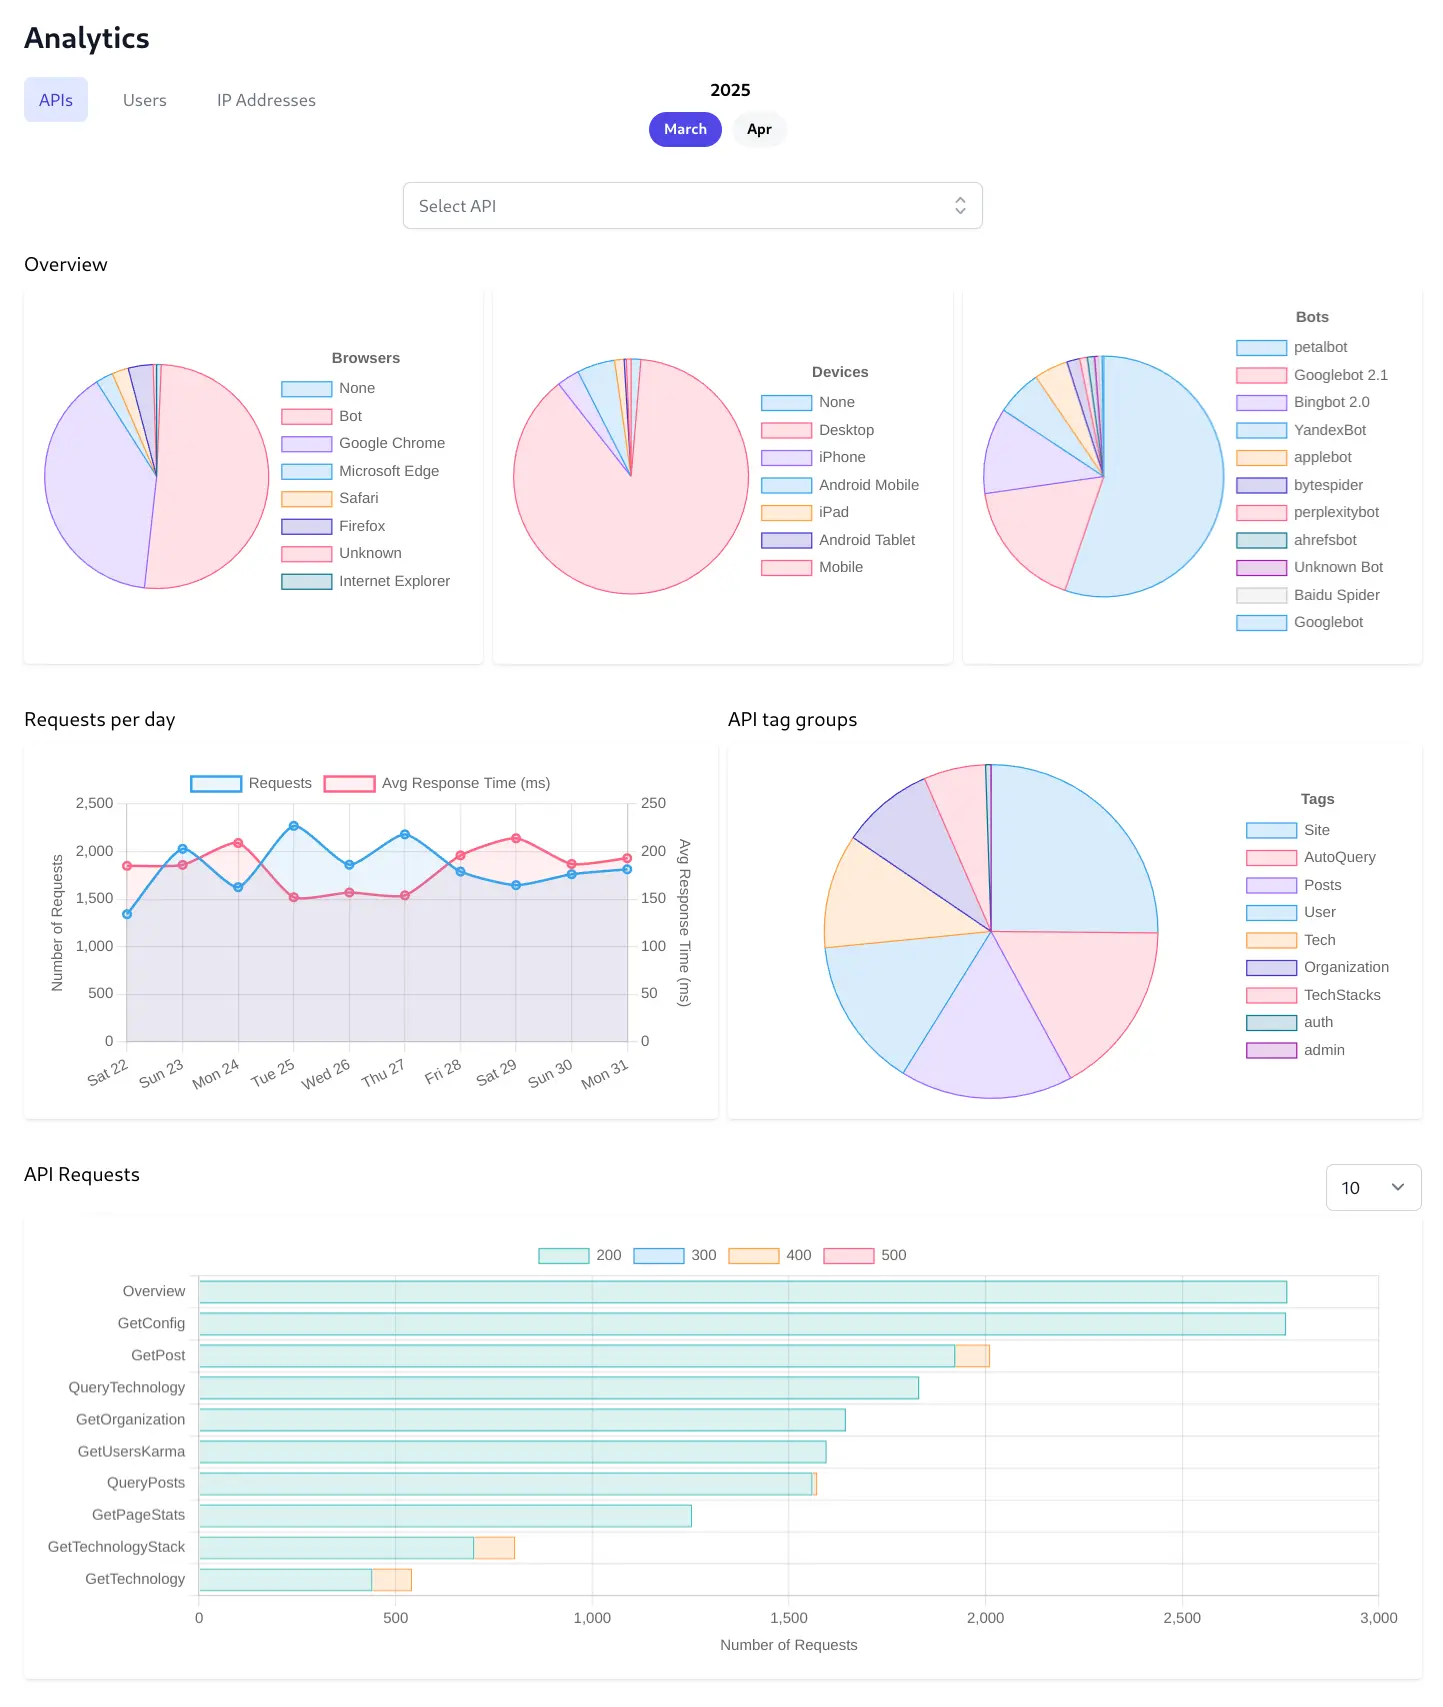
Distribution Pie Charts
Lets you quickly understand the composition of your user base and traffic sources and the distribution of users across different web browsers, device types, and to identify the proportion of traffic coming from automated bots.
Requests per day Line Chart
Lets you monitor API usage trends and performance over time. It tracks the total number of API requests and the average response time day-by-day. You can easily spot trends like peak usage hours/days, identify sudden spikes or drops in traffic, and correlate request volume with API performance which is crucial for capacity planning and performance troubleshooting.
API tag groups Pie Chart
Lets you understand the usage patterns across different functional categories of your APIs. By grouping API requests based on assigned tags (like Security, Authentication, User Management, Tech, etc.), you get a high-level view of which types of functionalities are most frequently used or are generating the most load.
API Requests Bar Chart
Lets you identify the most and least frequently used specific API endpoints which ranks individual API endpoints by the number of requests they receive. This helps pinpoint:
- Critical Endpoints: The most heavily used APIs that require robust performance and monitoring.
- Optimization Targets: High-traffic endpoints that could benefit from performance optimization.
- Underutilized Endpoints: APIs that might be candidates for deprecation or require promotion.
- Troubleshooting: If performance issues arise (seen in the line chart), this helps narrow down which specific endpoint might be responsible.

Total Duration Bar Chart
Identifies which API endpoints consume the most cumulative processing time over the selected period. Even if an API endpoint is relatively fast per call, if it's called extremely frequently, it can contribute significantly to overall server load. Optimizing these can lead to significant savings in server resources (CPU, memory).
Average Duration Bar Chart
Pinpoints which API endpoints are the slowest on a per-request basis. APIs at the top of this list are prime candidates for performance investigation and optimization, as they represent potential user-facing slowness or system bottlenecks.
Requests by Duration Ranges Histogram
Provides an overview of the performance distribution for all API requests. This chart shows how many requests fall into different speed buckets and helps you understand the overall responsiveness of your API system at a glance.
Individual API Analytics
Clicking on an API's bar chart displays a dedicated, detailed view of a single API endpoint's behavior, isolating its performance and usage patterns from the overall system metrics offering immediate insight into the endpoint's traffic volume and reliability.

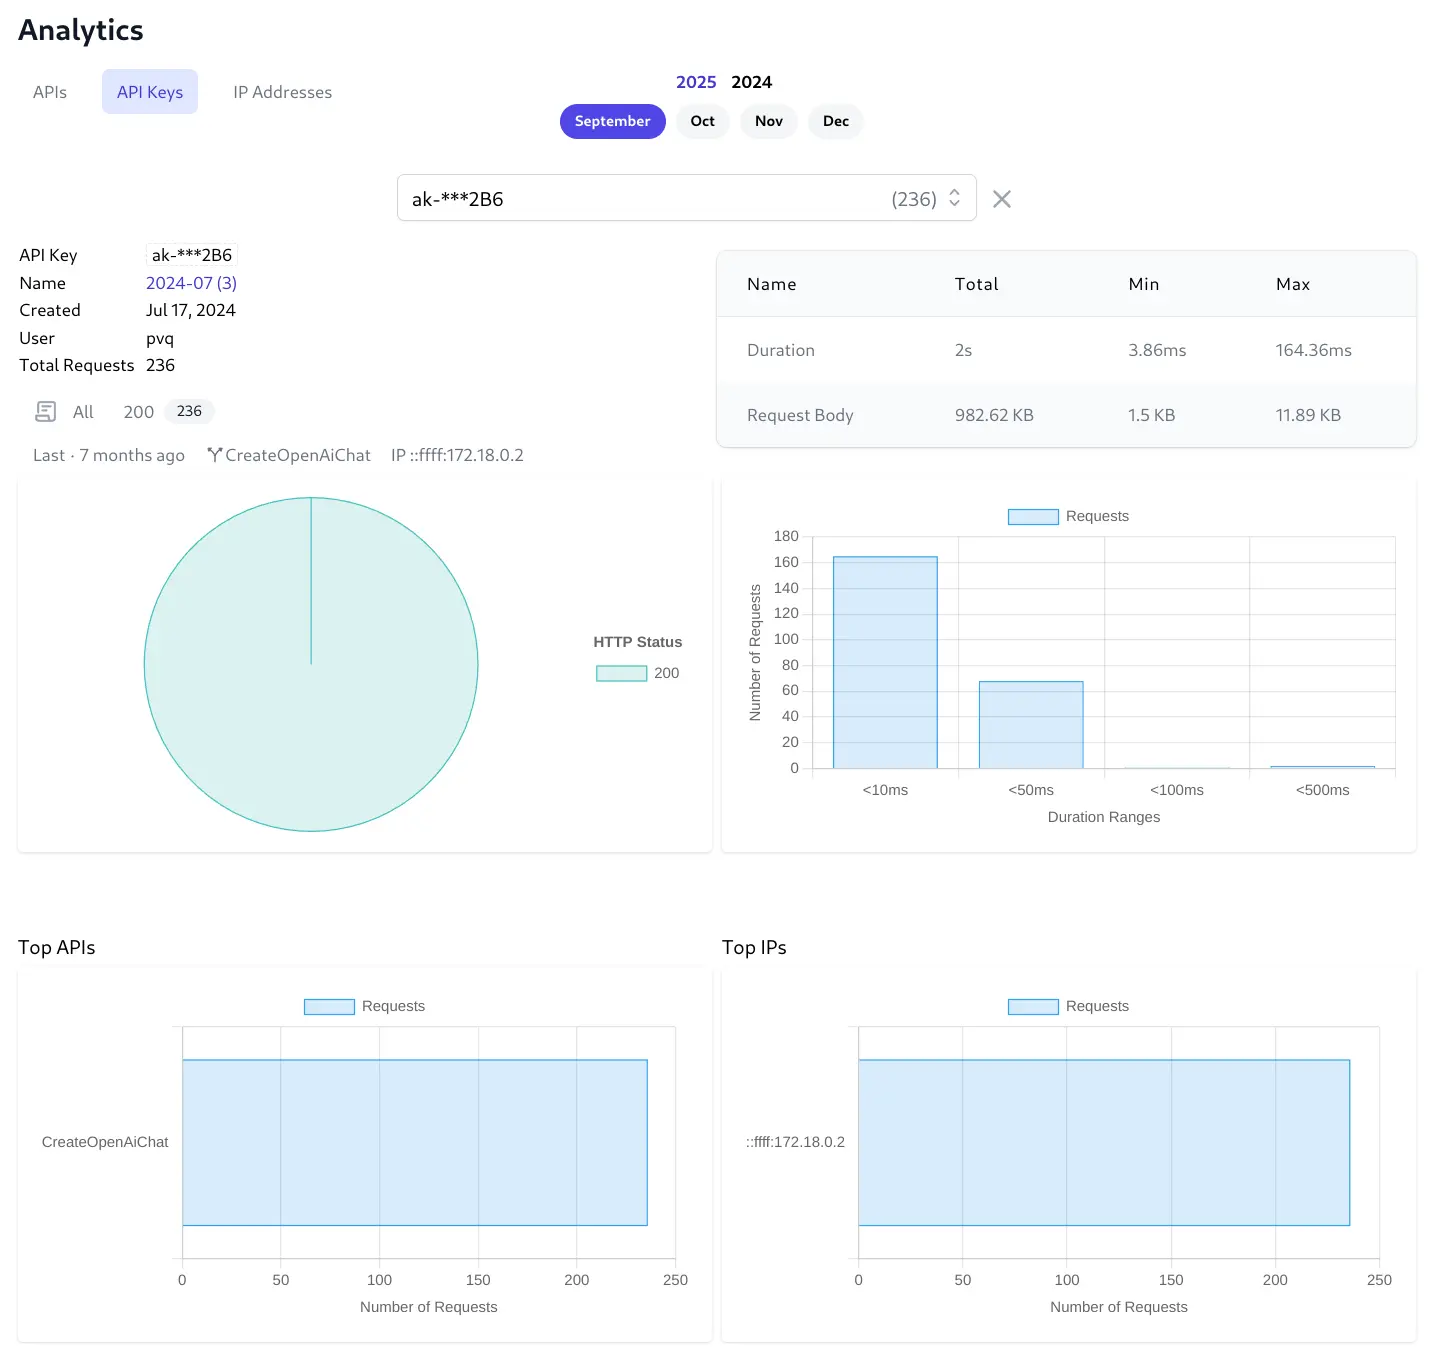
Total Requests
Displays the total requests for an API during the selected month. It includes HTTP Status Breakdown which provide direct access to the filtered request logs. This is a major benefit for rapid troubleshooting, allowing you to instantly view the specific log entries corresponding to successful requests or particular error codes for this API.
Last Request Information
Provides immediate context on the most recent activity for this endpoint with when the last request occurred, the source IP address and device information to help understand recent usage and check if the endpoint is still active, or quickly investigate the very last interaction if needed.
Duration Summary Table (Total, Min, Max)
Quantifies the performance characteristics specifically for this endpoint with the cumulative (Total) processing load, the best-case performance (Min), and the worst-case performance (Max) which is useful for identifying performance outliers.
Duration Requests Histogram
Visualizes the performance distribution for this API.
Top Users Bar Chart
Identifies which authenticated users are most frequently calling this API and relies on this endpoint the most. This can be useful for identifying power users, potential API abuse by a specific user account, or understanding the impact of changes to this API on key users.
Top IP Addresses Bar Chart
Shows which source IP addresses are generating the most traffic for this API. Useful for identifying high-volume clients, specific servers interacting with this endpoint, or potentially malicious IPs.
Users
The Users tab will display the top 100 Users who make the most API Requests and lets you click on a Users bar chart to view their individual User analytics.

Individual User Analytics
Provides a comprehensive view of a single user's complete interaction history and behavior across all APIs they've accessed, shifting the focus from API performance to user experience and activity.
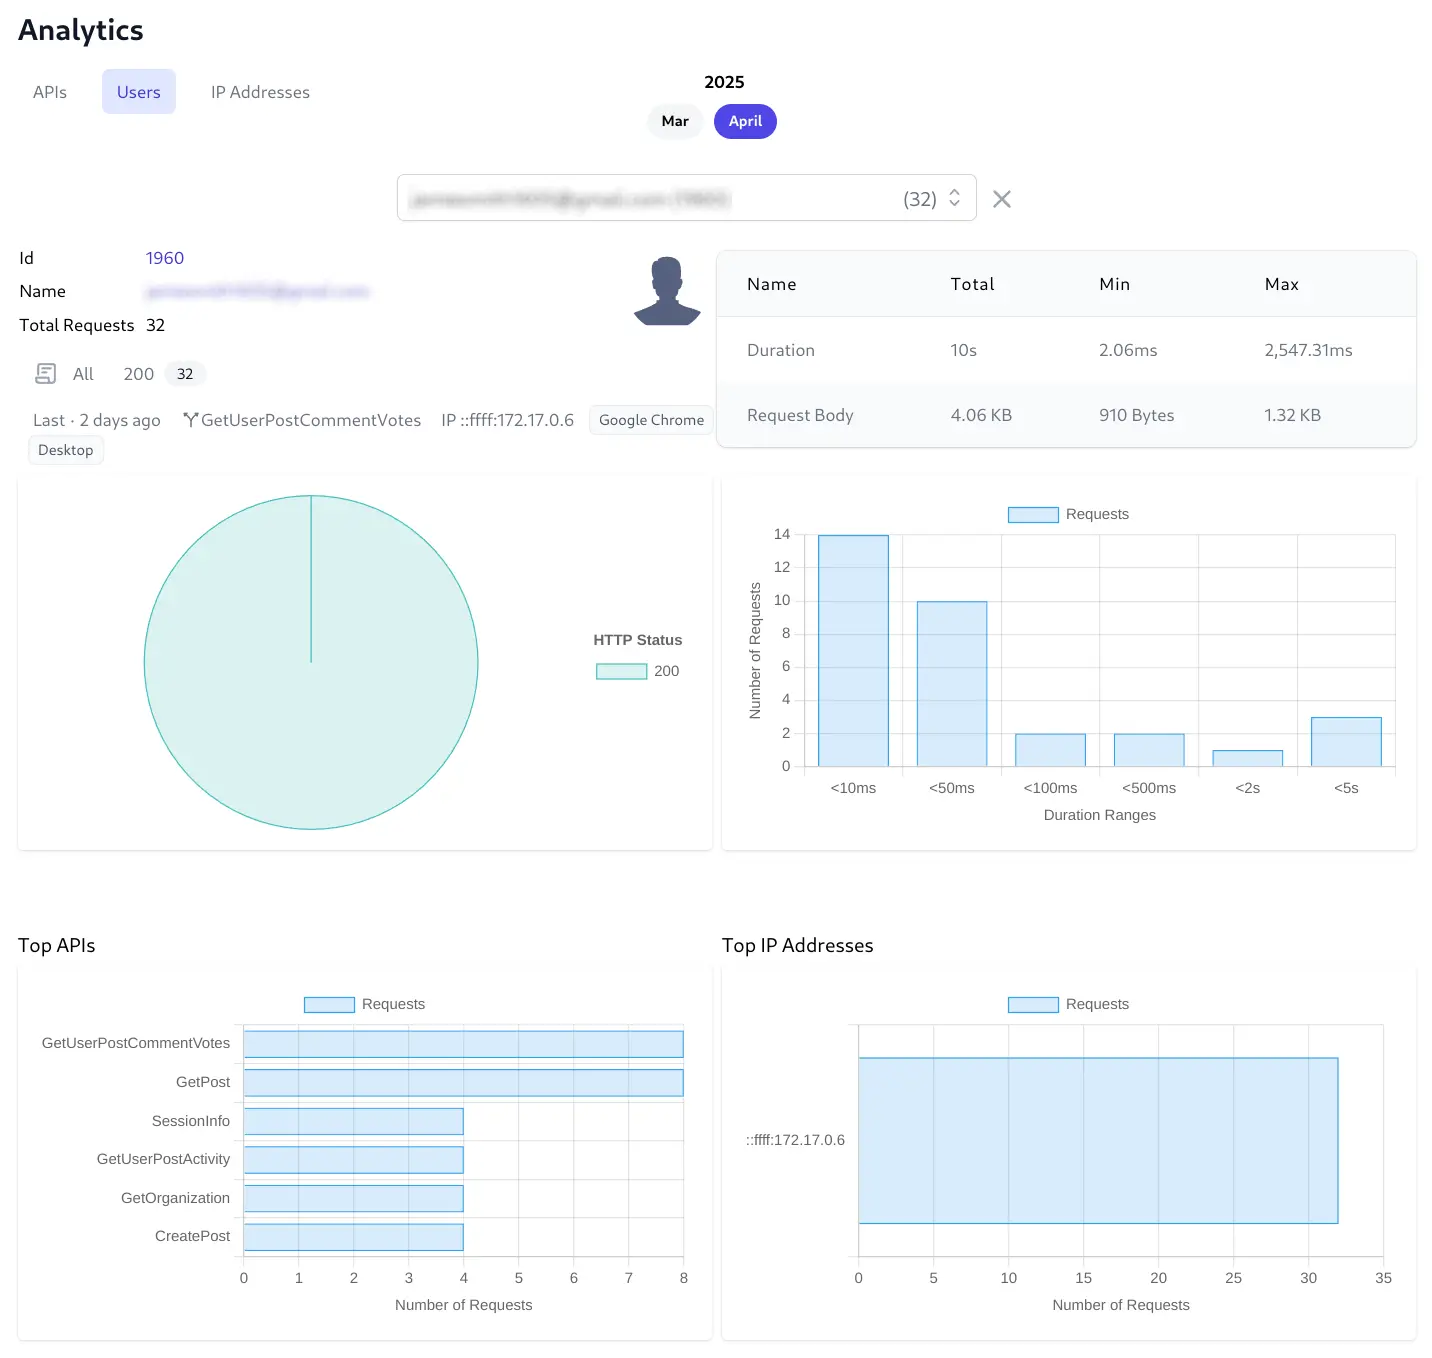
User Info & Total Requests
Identifies the user and quantifies their overall activity level. Clicking on their ID or Name will navigate to the Users Admin UI. It also shows their success/error rate via the clickable status code links. This helps gauge user engagement and baseline activity.
Last Request Information
Offers a snapshot of the user's most recent interaction for immediate context. Knowing when, what API they called, from which IP address, using which client & device is valuable for support, identifying their last action or checking recent activity.
HTTP Status Pie Chart
Visualizes the overall success and error rate specifically for this user's API requests.
Performance & Request Body Summary Table
Quantifies the performance experienced by this user and the data they typically send.
Duration Requests Histogram
Shows the distribution of response times for requests made by this user to help understand the typical performance this user experiences.
Top APIs Bar Chart
Reveals which API endpoints this user interacts with most frequently and help understanding user behavior and which features they use most.
Top IP Addresses Bar Chart
Identifies the primary network locations or devices the user connects from.
User Admin UI Analytics
To assist in discoverability a snapshot of a Users Analytics is also visible in the Users Admin UI:

Clicking on View User Analytics takes you to the Users Analytics page to access to the full Analytics features and navigation.
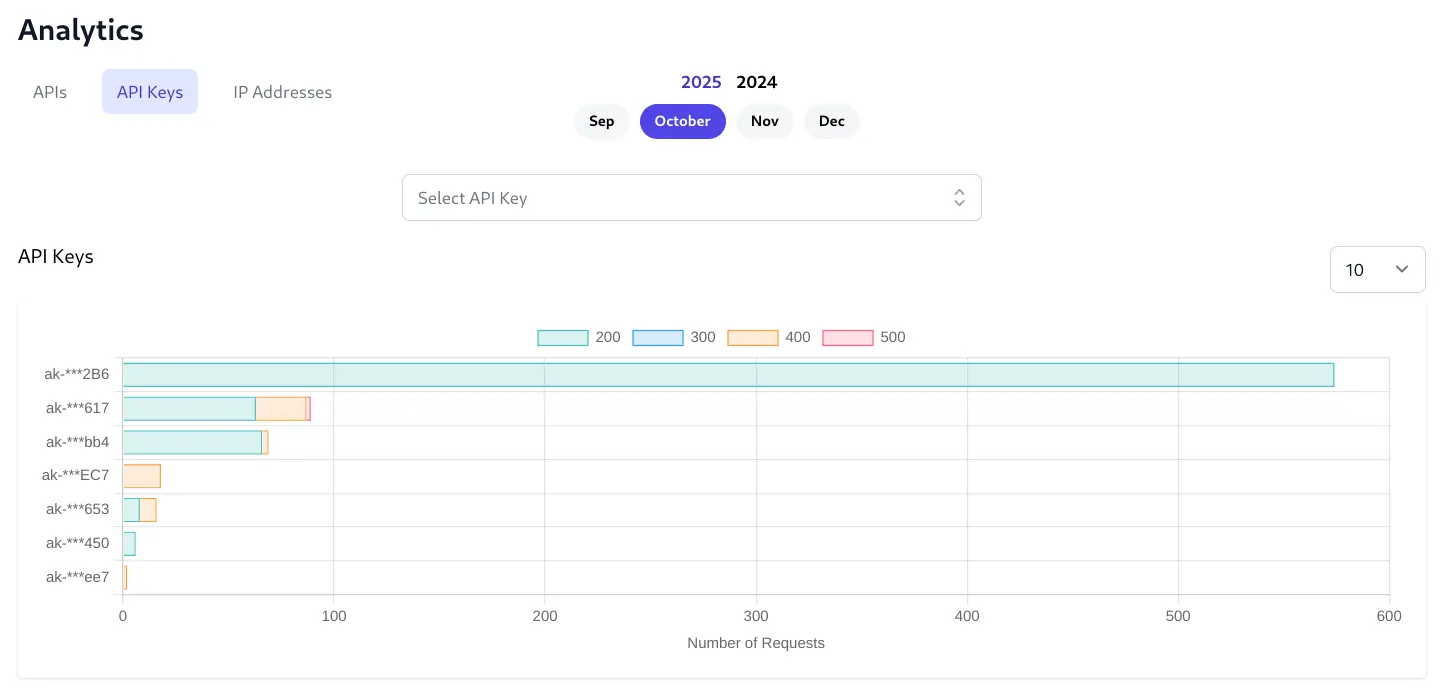
API Keys
The API Keys tab will display the top 100 API Keys who make the most API Requests and lets you click on an API Key bar chart to view its individual API Key analytics.
Individual API Key Analytics
Provides comprehensive API Key analytics Similar to User Analytics but limited to the API Usage of a single API Key:
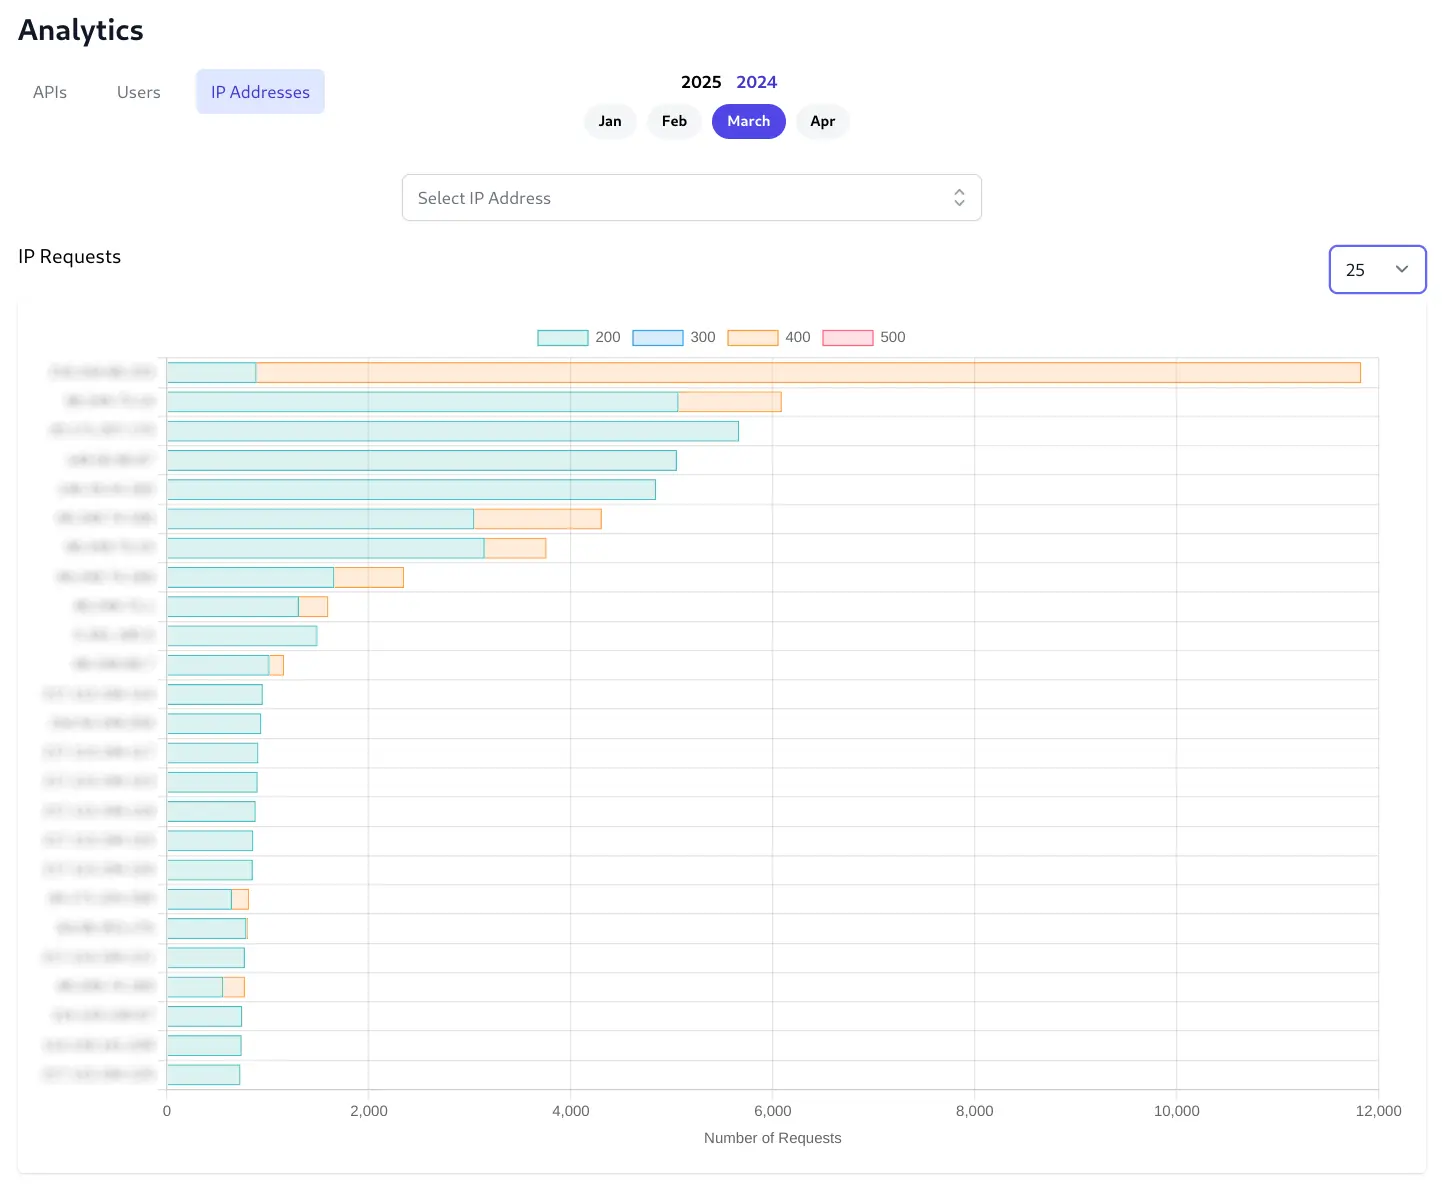
IPs
The IP Addresses tab will display the top 100 IPs that make the most API Requests. Click on an IP's bar chart to view its individual analytics made from that IP Address.
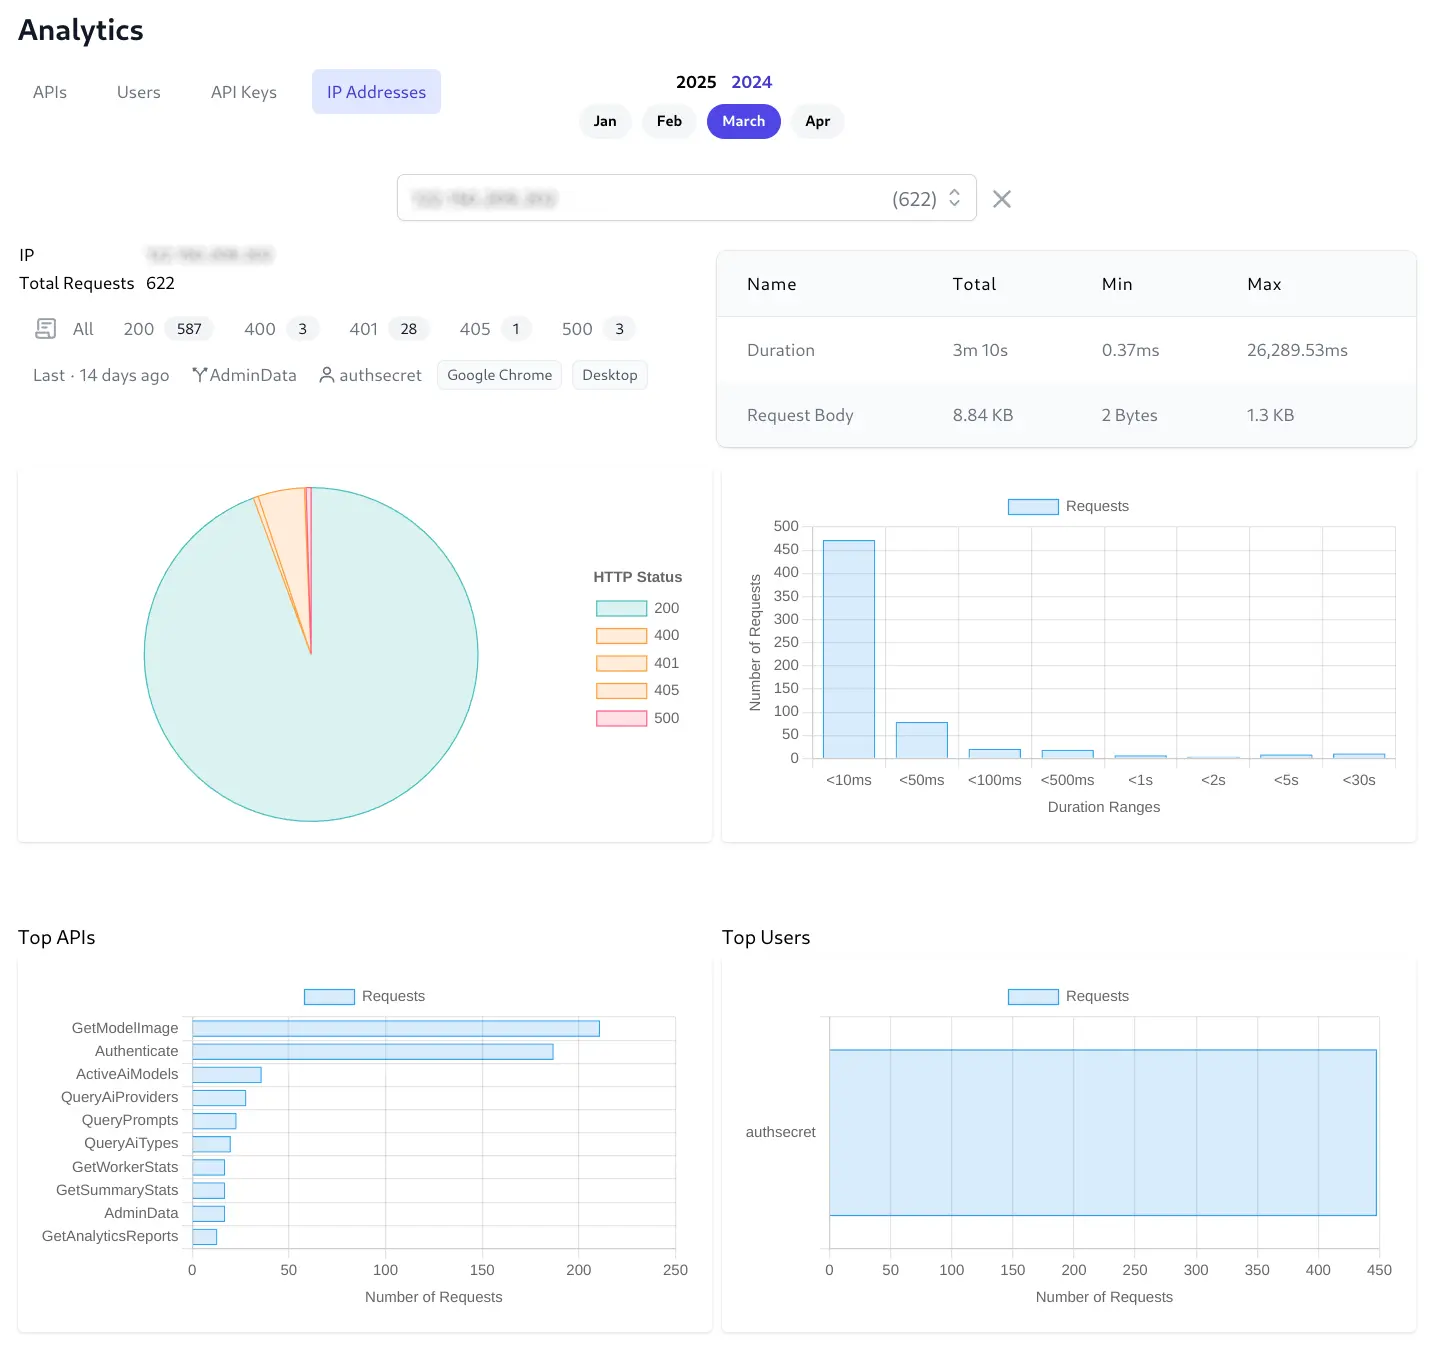
Individual IP Analytics
Provides comprehensive IP Address analytics Similar to User Analytics but limited to the API Usage from a single IP Address: